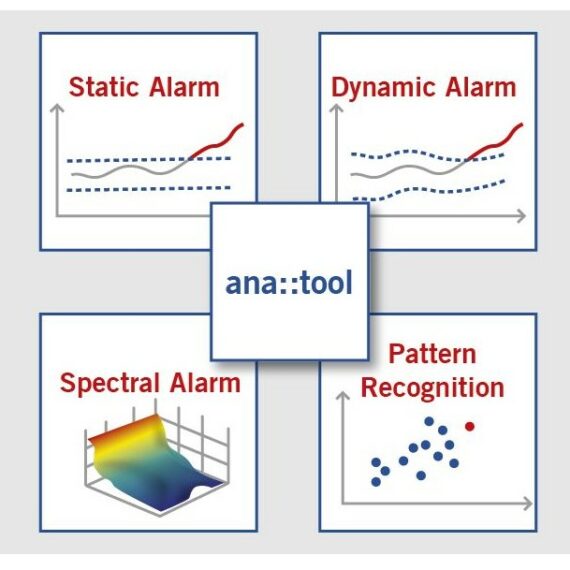
Event Detection System – Overview ana::tool identifies unknown and unusual conditions and enables operators to react timely to faults in the monitored system. It determines the normalcy of data and triggers an alarm when a significant deviation from normal is detected. ana::tool evaluates measurement data that have been cleaned by the validation module. It combines Static Alarms, Dynamic Alarms, Pattern Recognition and Spectral Alarms. Once an alarm is detected, the user has to provide feedback, so the system can learn which alarms are real and which ones represented normal changes in water quality. This will increase system performance over time. Gradual composition changes (e.g. seasonal variations) are accounted for by automatic training on a moving time window. It has an open interface to all types of sensors and measuring devices from other manufacturers. Other data sources can also be used. Event Detection System – Features Unmatched event detection tools Proven algorithms for real-time event detection Uses data streams from all connected probes separately and in combination The only software developed to be specifically capable of exploiting the information contained in UV spectra Optimised for use of multi-dimensional spectral data, but also suitable for single or multiple one-dimensional inputs Applies a variety of algorithms during real-time analysis of data and automatically weights the results as appropriate So far the only commercial software package tested and accepted by the US-EPA water security division All event information is automatically aggregated into a “traffic light” output and a “% deviation from normal” output Analogue and digital outputs as well as text notifications can be triggered Trains itself on any type of data stream coming in, and will learn automatically Configurable auto-correction of data based on threshold, outlier and noise analysis Open interface to all types of sensors and measuring devices- also from other manufacturers Other data sources can also be used Online and real-time validation of data before event detection Significantly reduces false alarm rate Graphic user interface provides an overview of the entire station at a glance Web-based interface, allows access at any time from any location Includes an indicator of actual alarm sensitivity Can calculate the contribution of individual water sources A, B, C, … to the total water mix